This article is a very good introduction to the Kinematic Sequence. It discusses the downswing, the transition and gives a few examples.
In sports such as golf that need to create maximal speed of a distal segment or implement (club, bat, racket etc.), it is generally found through motion analysis techniques, that there is a precisely timed sequence of body segment motions progressing from the proximal (inner), large segments to the distal (outer), smaller segments. In the biomechanics literature this is often called "proximal-to-distal-sequencing", "kinetic linking" or the term I prefer; the "Kinematic Sequence".
Downswing Phase
During the downswing in golf all body segments must accelerate and decelerate in the correct sequence with precise and specific timing so that the club arrives at impact accurately and with maximal speed. The most efficient sequence of motion for the major segments is: pelvis, thorax (upper body), arms and finally club. This motion must occur sequentially with each peak speed being faster but fractionally later than the previous one. This sequence reflects an efficient transfer of energy across each joint and facilitates an increase in energy from the proximal segment to the distal one. The muscles of each joint produce this increase in energy. On the other hand, if the timing of energy transfer is wrong, energy can be lost and hence speed will be lost; also if one body part has to compensation because another is not acting correctly then injury may result.
In the downswing, the larger, inner segments such as the pelvis and thorax move slower with the speed building as the energy progresses to the smaller distal segments such as the arms and club. Note that the pelvis does not continue accelerating through impact, but decelerates before impact.
In order to quantify the differences in the Kinematic Sequence between golfers we compare specific values from the segmental rotational speed curves. For example, we can look at the maximum rotation speeds of each segment; progressive speed gains between segments; sequence of maximum speeds; timing of maximum speeds with respect to impact; average accelerations and decelerations before impact. Using these values we can quickly tell what segment of the body is not performing optimally.
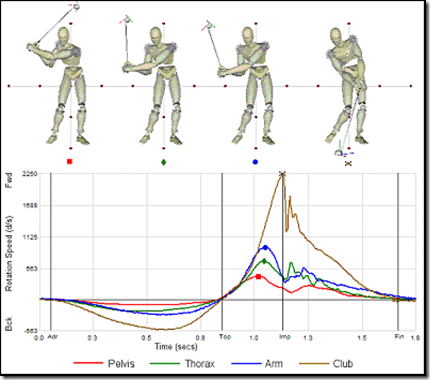
In summary, and looking at the graph on the first page in the downswing phase; between Top (of the backswing) and Imp (impact) the Kinematic Sequence proceeds as follows:
- Pelvis (red) accelerates and peaks at a lower speed than the other segments, and then decelerates rapidly.
- Thorax (green) accelerates to a higher speed than the pelvis, and then decelerates rapidly.
- Lead Upper Arm (blue) accelerates to a higher speed than the thorax, and then decelerates rapidly.
- Club (brown) continues accelerating reaching maximum speed at impact.
Notice also that each segment speed peaks slightly later than the previous highest speed, that is, each peak is more to the right of the previous one. The pictures of the golfer show the body position at each of the peak rotational speeds; from left to right, pelvis peak, thorax peak, lead arm peak, and club peak. The pictures should clearly show (looking at the position of the golf club) that the pelvis peaked first, then the thorax, then the arm and then the club. The peak for the thorax and arm will be very close so these two pictures should show the club at almost the same location. There should be a larger time between the pelvis peak and thorax peak; and again between the arm peak and the club peak. The club rotational speed should peak at impact; notice in fact that it is still going up at impact. This means that the club is still accelerating at impact.
Transition Phase
Another important section of the Kinematic Sequence is the Transition Phase. This is the area of the graph surrounding the top of backswing (Top), when the golfer transitions from the backswing to the downswing. The Top of Backswing is considered to be when the club turns around from the backswing to the downswing. The Transition Phase is defined as the period of time between the first body segment turnaround and the last segment (or club) turnaround. The biomechanically efficient Transition Phase starts at the bottom and works up, going from the pelvis to the thorax, the arm and then the club.
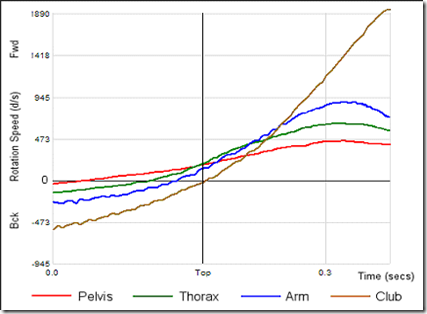
In the graph above we have zoomed in on the Transition Phase of a pro swing and the swing progresses in time from left to right. Any part of the curve below the black horizontal zero line is in the backswing, any part that is above this line is in the downswing. Starting from the left of the graph we see that the red (pelvis) line crosses zero first, then the green (thorax) line, then the blue (lead arm) and finally the brown (club). The club crosses exactly at top of backswing because this, as mentioned, is our definition of top; the point at which the club shaft changes direction. Since the x-axis of the graph is time, the distance from when the red curve crosses zero to when the brown line crosses zero is the time from when the pelvis changed direction to when the club changes direction; the Transition Phase. This transition sequence shown is considered biomechanically correct as far as the order is concerned, that is, a good transition order is pelvis, thorax, lead arm, and club.
The amount of time that the red curve is on top of the green curve after it has crossed the zero line gives an indication of how much transitional spine stretch (X-Factor Stretch) is occurring, since when the red is on top of the green it means that the pelvis is rotating faster than the thorax and hence the spine stretch is increasing. This same rule can be applied to each curve or body segment. Look at when the green crosses the zero line. The time that it is on top of the blue line after crossing zero indicates that shoulder stretch is occurring, because the thorax is rotating faster than the lead arm and the shoulder angle must therefore be closing. Finally after the blue curve has crossed zero means that the lead arm is in the downswing. So the time it stays on top of the brown curve after crossing zero indicates how much wrist stretch is occurring.
Due to the structure of muscles and connective tissue, it is advantageous to cause the muscle and joint to get this extra stretch during the transition period. It helps transmit more energy and speed to the following body segment. If the transition sequence described above is not optimal elastic energy from the muscles and joint is lost.
Note that since the above graph is “zoomed in” this transition phase is exaggerated, normally the distance from the red crossing to the brown crossing will not look so large, and in fact if this distance is too large it means that the golfer is taking too long to transition and may be loosing the benefit of the muscle stretch (known as the “Stretch-Shorten Cycle”).
Comparison of Pro’s and Amateurs
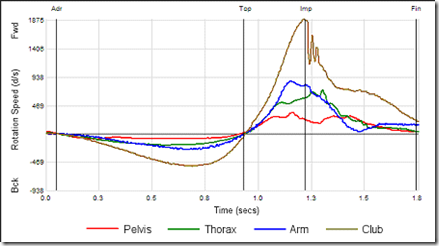
If the brown curve (club) gets on top of the other curves soon after top of backswing, then this is a good indication that casting is occurring. In the example graph below, very soon after top of backswing the club is rotating faster in the swing plane than the arm and so the wrist angle is opening, indicating casting. Notice that to the right of the “Top” line, the brown curve is above every other curve. This graph shows an inefficient Kinematic Sequence of a high handicap player.
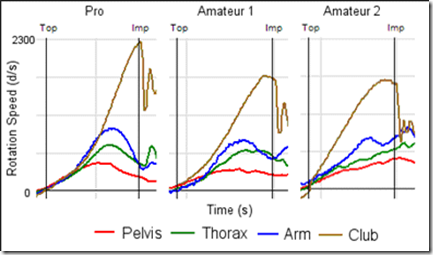
Let’s put three examples side by side and examine the relationships of each of the four curves during the downswing phase.
From the graphs above it can be seen that “Pro” has relatively smooth accelerations and decelerations with each subsequent segment’s speed peaking higher and later than the previous one. Notice also that the club’s speed peaks at impact and in fact is still going up at impact; this means that the club is still accelerating when it hits the ball. Amateur 1 shows lower speeds; poorer accelerations and decelerations; and the peaks are out of sequence with the arm peaking before the thorax. Amateur 2 has no decelerations of the pelvis and thorax before impact, but has a little deceleration of the arm (followed by a re-acceleration before impact). Both amateurs cast the club and it races ahead of the other body segments; this is evident from the fact that the brown curve is on top of the other curves. This casting action causes the club to peak early and even decelerate a little before impact loosing speed and power. In contrast notice the Pro curves; near the middle portion of the graph the arm (blue) is actually on top of the club (brown). This means that the wrist is cocking more just before release. This action will tend to allow more energy to be supplied to club release from the efficient use of the “stretch-shorten cycle” of the forearm muscles. Since the graphs are scaled equally you can see that the club speed of the pro at impact is higher than that of both amateurs.
Phil Cheetham has been an innovator in sport biomechanics for over 25 years. He is an Olympian in Gymnastics from Australia. Phil is co-founder and CEO of Advanced Motion Measurement, Inc. and director of the Titleist Performance Institute Biomechanics Advisory Board. Dr. Greg Rose and the Titleist team call him the “3D Guy” because his science in 3D Motion Analysis has proved to be the best available to analyze and improve human athletic motion.
The data for this article was captured by the AMM3D Motion Analysis System using TPI 3D protocols.
Copyright © Phil Cheetham, February 2008


No comments:
Post a Comment